
Lesser Known Features of the Browser Console
The browser console is a frontend developers best friend.
While we are all aware of the basic methods like console.log(), console.warn(), console.debug(), or console.error(), are you aware of some of the lesser known, but still powerful, features?
Let’s dive in!
Grouping Output
With the console.group(), console.groupCollapsed(), and console.groupEnd() methods, we can easily group console output within collapsible groups and subgroups.
console.group( groupName )
Starts a new group with the supplied name.
console.groupCollapsed( groupName )
Starts a new group with the supplied name that is collapsed by default.
console.groupEnd()
Ends the current console group.
console.group("Group #1");
console.log("Item 1");
console.log("Item 2");
console.log("Item 3");
console.log("Item 4");
console.group("Subgroup");
console.log("Subitem 1");
console.log("Subitem 2");
console.log("Subitem 3");
console.log("Subitem 4");
console.groupEnd();
console.groupEnd();
console.groupCollapsed("Collapsed Group");
console.log("Collapsed item 1");
console.log("Collapsed item 2");
console.log("Collapsed item 3");
console.log("Collapsed item 4");
console.groupEnd();
String Substitutions
When using console.assert(), console.log(), console.info(), console.warn(), console.error(), or console.trace(), you can use string substitution within the message that is passed into the method.
%o or %O - JavaScript object
const user = { name: "Kevin" };
console.log("The user is %o!", user);
// The user is ▸ {name: 'Kevin'}!%d or %i - Integer (Number formatting is supported, only in Firefox and Safari, per my testing)
const count = 123;
console.info("The count is %d!", count);
// The count is 123!
console.info("The count is %.4d!", count); // This only works in Firefox and Safari 😕
// The count is 0123!%s - String
const name = "Kevin";
const state = "Florida";
console.warn("Hi my name is %s and I am from %s!", name, state);
// Hi my name is Kevin and I am from Florida!%f - Floating-point value (Number formatting is supported, only in Firefox and Safari, per my testing)
const average = 8.987;
console.log("The average is %f!", average);
// The average is 8.987000!
console.log("The average is %.4f!", average); // This only works in Firefox and Safari 😕
// The average is 8.9870!
const error = { errorMessage: "It failed!" };
console.error("The error was %o", error);
// The error was {errorMessage: 'It failed!'}Styling Console Output
Using the %c specifier in strings allows us to apply styles to console output. The output string in the first parameter has the style rules in the subsequent parameters applied to it in their respective places in the string.
console.log("%cStyled content #1!", "background: #222; color: #f9b434");console.log(
"%cStyled content #1! %cStyled Content #2!",
"background: #222; color: #f9b434",
"background: #f9b434; color: #222;",
);console.log(
"%cJavaScript",
"font-weight: 700; font-size: 50px; color: #fff; text-shadow: 3px 3px 0 #f00, 6px 6px 0 #ffa500, 9px 9px 0 #ff0, 12px 12px green, 15px 15px #00f, 18px 18px #4b0082, 21px 21px #ee82ee;",
);
Assertions
Using console.assert() you can validate an assertion and write an error message to the console if the assertion fails.
console.assert( assertion, obj [obj2, ..., objN]);
console.assert( assertion, msg [strSub, ..., strSubN]);let value = true;
console.assert(value, { error: "Did not work", value }); // No output
value = false;
console.assert(value, { error: "Did not work", value });
// Assertion failed: {error: 'Did not work', value: false}
console.assert(false, "This is a %o test", { error: "Did not work", value });
// Assertion failed: This is a ▾ {error: 'Did not work', value: false} testCounting Instances
Using console.count() you can create a simple counter that will count the number of times it is called with the specified label.
And with console.countReset(), you can easily reset that counter.
console.count([label]);
console.countReset([label]);const order = ["item1", "item2", "item3"];
function processItem(item) {
console.count(item);
return item;
}
for (const item of order) {
processItem(item);
}
// item1: 1
// item2: 1
// item3: 1
processItem(order[0]);
processItem(order[0]);
processItem(order[0]);
processItem(order[1]);
// item1: 2
// item1: 3
// item1: 4
// item2: 2
// Let's reset the count.
console.countReset(order[0]);
// Let's count it once more to show it starts at 0 again.
processItem(order[0]);
// item1: 1Browser Profiling
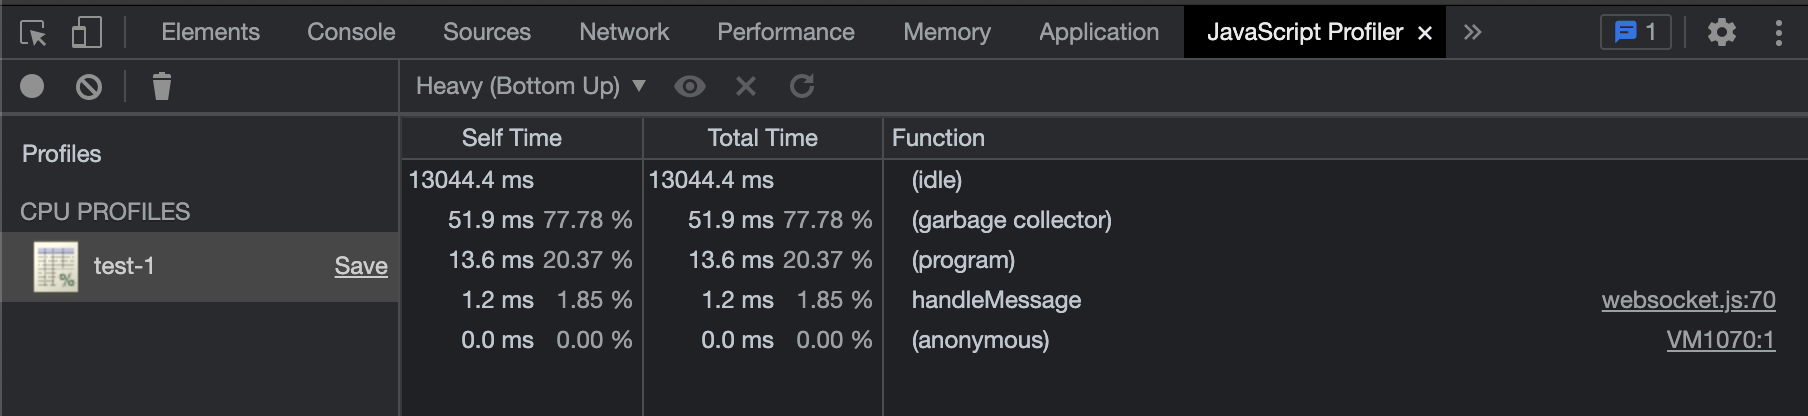
With the console.profile() and console.profileEnd() methods, you can easily run some JavaScript profiling.
Where the profiling data is displayed depends on the browser being used.
In Firefox, you’ll find the profiling data within the Performance tab in the developer tools.
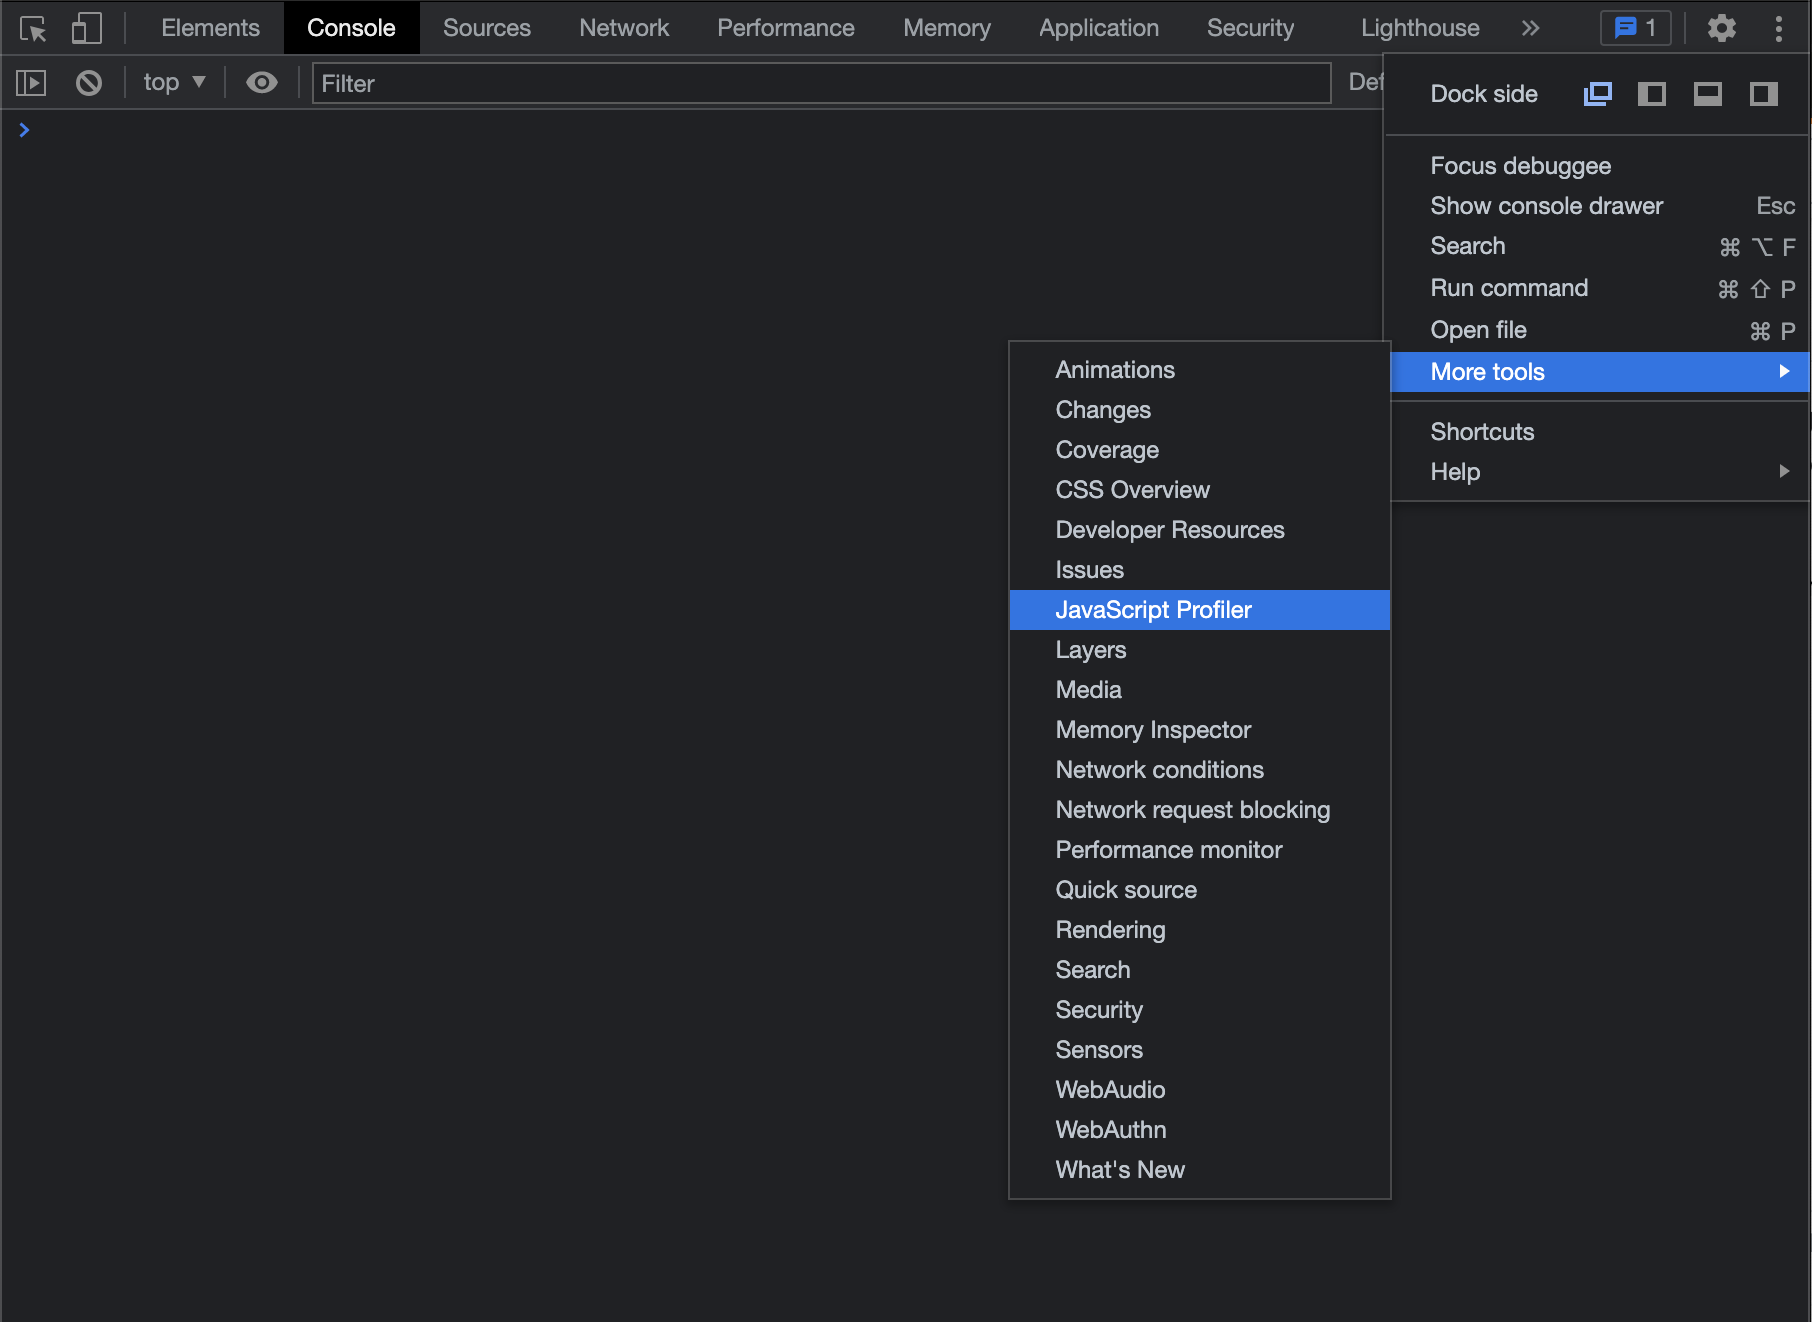
In Chrome, you’ll find the JavaScript Profiler tab by navigating to the three-dot menu -> More tools -> JavaScript Profiler.
And the data is displayed in the main frame of the developer tools.
It should be noted that this feature is not standard in the specification, so do not use it in production at all.
Formatting Tabular Output
You can format an object as tabular data very easily using console.table()!
You are able to pass any primitive values here also, but they render like how console.log() does.
Objects are where this method really shines.
const user = { name: "Kevin", location: "Florida", age: 33 };
console.table(user);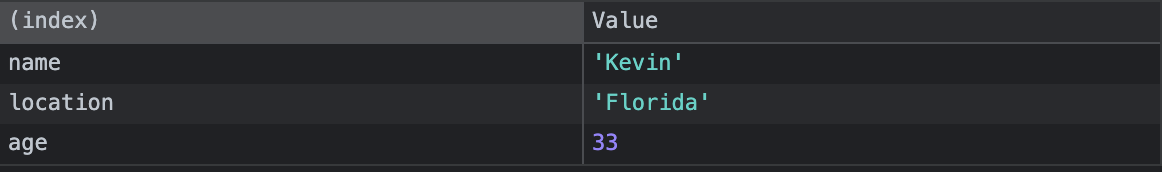
Stack Trace
Wth the console.trace() method, we can print a stack trace to the web console.
You can also pass in data parameters and they will be formatted like console.log is.
function testTrace() {
console.trace();
}
testTrace();
// console.trace
// testTrace
// (anonymous)